Data Analytics Courses Online:
Data Analyst is a professional who collects, processes and performs statistical analysis on large datasets to support decision-making and produce business strategies. Data Analyst responsibilities include:
- Collect and analyse data from different sources through different tools and techniques that help in statistical methods, like SQL, R and Python.
- Clean and manipulate data as well as corroborate data and ensure accuracy and completeness.
- Build predictive models and conduct ad-hoc analysis in order to help them with data-driven decisions.
- Collaborate intersectionally with different teams of engineering, product management, and marketing and support business decisions.
- Be updated with recent technological advancements, industry trends, and different data analysis techniques.
The average salary of a data analyst in India ranges between Rs 2.0 Lakhs and Rs 12.0 Lakhs and $72,617 in the USA.

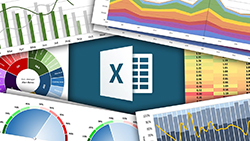
Mastering Excel Data Visualization: Static Charts & Graphs
Last Updated: 2022-10-13
Learn how to start an online business with Amazon Kindle Direct Publishing (KDP) and the strategies to be successful.
How will Learnfly help you become a better Data Analyst?
Under the guidance of experts and professionals in the domain, you will learn the foundations of data analysis and gain data analytics certification like:
- Mathematical and statistical concepts such as linear algebra, probability, calculus
- Data wrangling and cleaning
- Creating informative visualisation of data
- Predictive modelling
- Machine learning
- Coding and Programming language
Course Overview:
If you’ve spent time in spreadsheet software like Microsoft Excel, Apple Numbers, or Google Sheets and are eager to take your data analysis skills to the next level, this course is for you!
Data Analysis with Pandas and Python introduces you to the popular Pandas library built on top of the Python programming language. Pandas is a powerhouse tool that allows you to do anything and everything with colossal data sets — analyzing, organizing, sorting, filtering, pivoting, aggregating, munging, cleaning, calculating, and more!
Over the course of more than 19 hours, you’ll be guided step-by-step through Pandas, from installation to visualization, covering hundreds of different methods, attributes, features, and functionalities packed away inside this awesome library. You’ll be diving into tons of different datasets, short and long, broken and pristine, to demonstrate the incredible versatility and efficiency of this package.
Data Analysis with Pandas and Python is bundled with dozens of datasets for you to use. Whether you’re a new data analyst or have spent years (*cough* too long *cough*) in Excel, Data Analysis with pandas and Python offers you an incredible introduction to one of the most powerful data toolkits available today!
What are the expected prerequisites?
- Knowledge of Mathematical and statistical concepts such as linear algebra, calculus and probability.
- Basic experience as a data analyst with Python and R programming languages.
- Cleaning and maintaining Data
- Students of finance, computer science, mathematics, economics, commerce, and political science along with experience in a business or technical role can apply.
- Basic knowledge of Excel is a plus, but not required
- Microsoft Excel 2010, 2013, 2016, 2019
- Passion for Excel and online learning
Targetted Audience:
- Data analysts and business analysts.
- Excel users looking to learn more powerful software for data analysis.
- You’ll be learning about concepts including Data Extraction from CSV files, Data Extraction from Excel Files, Data Extraction from CLIPBOARD, URL, XML & JSON Files, Data Extraction from Databases, Loading data into Python, Loading data from CSV, Excel & URL into Python, Data Science and Machine Learning.
- Data analysts hoping to develop advanced data modelling, dashboard design, and business intelligence skills
- Anyone looking to pursue a career in data analysis, business intelligence, financial modelling, marketing research, reporting
What you’ll learn after this course?
- Learn different techniques for data analysis that can be easily implemented in Excel 2010, 2013, 2016, and 2019
- Work with real-world data sets and solve real-world tasks
- Execute aggregation commands (SUM, SUBTOTAL, etc.) and their conditional variants (SUMIFS, COUNTIFS, etc.) to summarize data sets
- Learn best practices for data analysis and data presentation using PivotTable and PivotChart tools
- Transform Data into insight using powerful methods of analysis, techniques and tools
- Learn 50 frequently used functions in Excel (Logical, Text, Date, Math, Statistical, Financial)
- Combine data from multiplied worksheets by VLOOKUP, INDEX and MATCH functions
- Perform What-if analysis by Goal Seek, Data Table and Scenario Manager tools
- Perform statistical analysis by using Data Analysis ToolPak including Linear Regression
How to sign-up for the course?
You need to purchase the courses offered. When you sign up, you’ll immediately have unlimited viewing of thousands of expert courses, paths to guide your learning, tools to measure your skills and hands-on resources like exercise files. There’s no limit on what you can learn and you can cancel at any time


.jpg)
.jpg)


