Power Query can be used for data transformation and analysis. Using Power Query (also referred to as Get & Transform in Excel), you may import or connect to external data and then modify that data to match your needs, for as by removing a column, changing the data type, or merging tables. When you’re ready to produce charts and reports, load your query into Excel. You may periodically update the data by refreshing it.
Data is extracted, transformed, and loaded using a variety of sources, including databases, websites, and CSV files. Power Query offers a user-friendly interface for processing data, which is intended to make data preparation jobs easier.

MASTERCLASS – Microsoft Power Query Fundamentals Concepts with Tips & Tricks | Microsoft POWER BI
Last Updated: 2023-03-16
MASTERCLASS – Microsoft Power Query Fundamentals Concepts with Tips & Tricks | Microsoft POWER BI
Key Features of Power Query:
- Power Query offers a number of data transformation options, such as separating columns, combining tables, and data filtering. Moreover, it offers sophisticated transformations such as data pivoting and unpivoting.
- Power Query offers capabilities for data purification, including the ability to eliminate duplicates, modify data types, and change values.
- External data source connections are supported by Power Query, including those to Microsoft SQL Server, Oracle, and Azure Data Lake.
- Using Power Query is simple because of its user-friendly, straightforward interface for data transformation and manipulation. Also, you are able to get a preview of the modifications before they are made to the data.
- Power Query automates the preparation and handling of data, which lowers mistakes and saves time.
NOTE: Three versions of Excel—Excel for Windows, Excel for Mac, and Excel for the Web—all support Power Query.
Four Phases in Power Query:
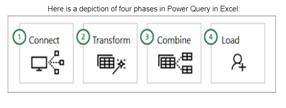
- CONNECT: Power Query allows you to import data into several databases, feeds, or cloud-based services in addition to a single data source like an Excel spreadsheet. Next, using Power Query, you can combine all of those data sources in order to discover insights that you otherwise wouldn’t have discovered by utilising your own special transformations and combinations. After importation, the data may be updated to include additions, modifications, and deletions made by the external data source.
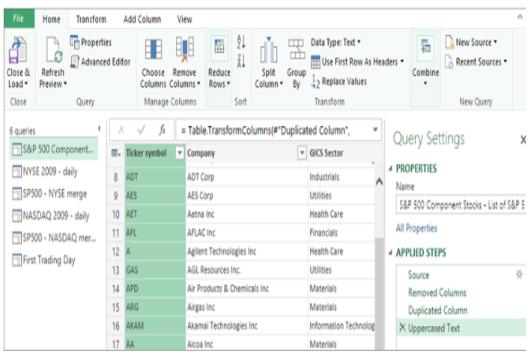
- TRANSFORM: Data transformations are facilitated and shown by Power Query using a special window called the Power Query Editor. In addition to opening when you connect to a data source, create a new query, or load a query, the Power Query Editor also opens when you pick Launch Query Editor from the Get Data command in the Get & Transform Data group.
Each transformation is viewable and modifiable in the APPLIED STEPS section of the Query Settings window.
- COMBINE: there are two operations:
- Append: produces a new query that combines all of the rows from the first and second queries.
- Merge: from two current queries, produces a new query. All columns from a main table are included in one single query, and one column acts as a connection to another related table.
- LOAD: to load queries, use the load option from the Query Options dialog box.
Here are the basic steps to use Power Query in Excel:
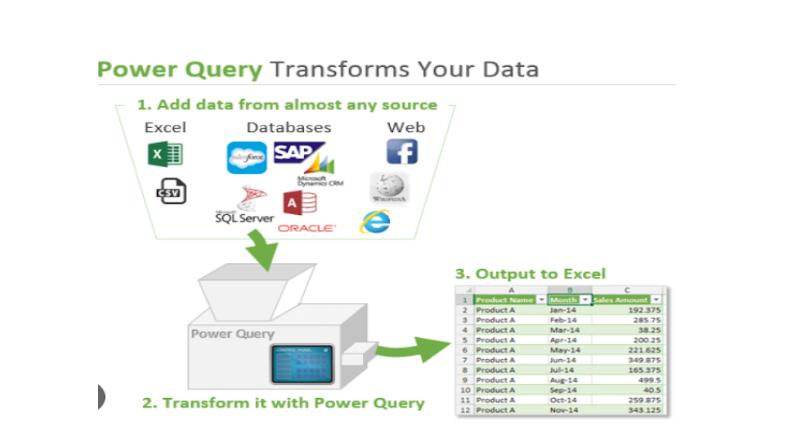
Image source: excelcampus.com
- Click “Get Data” in the “Get & Transform Data” group on the “Data” tab of Excel. Decide whether you want to utilise an Excel workbook, a text file, or a database as your data source. A cloud-based data source, such as Azure or SharePoint, is another option for connection.
- Connect to the data source by following the on-screen instructions and choosing the data you wish to work with. Once the data has been put into Power Query, you may start to alter it. This might entail operations like data filtering, sorting, combining, or pivoting.
- You may start transforming the data when you’ve put it into Power Query. This might entail operations like data filtering, sorting, combining, or pivoting.
- Using the buttons on the “Transform Data” page, you may alter your data further. You might divide a column, change a value, or aggregate data, for instance.
- Before using your modifications on the data, you may see a preview of the outcomes. This enables you to determine how the modifications will impact the data and make any required adjustments.